A Guide to the Analysis of Standby Power (EN50564:2011)
This application guide is intended to serve as a thorough overview of testing in accordance with EN50564:2011, we will offer an insight into the intricacies of the standard and what is required for compliance. We will explain how the requirements specified in EN50564:2011 (the replacement for IEC62301) apply to Energy Star and EU Standby Power directives.
Overview – Why do we test standby Power?
The current market is competitive and consumers now expect highly efficient devices that offer sophistication in order that a product will consume very little power when not in use without the need to disconnect the device from the mains. This is a reasonable expectation as technology now exists with the ability to significantly reduce power consumption of products when they are in an idle state. For household devices connected to the mains EN50564 was created (which has superseded IEC62301) in order to address issues related to measurement of low power devices, the low power devices mentioned in the standard can be any household mains powered device consuming a few watts or less.
EN50564:2011 – Overview
Many people assume that EN50564:2011 specifies limits for products in standby power mode whilst connected to the mains, this is in fact not the case as EN50564:2011 specifies test procedures for low power consumption equipment. It also offers guidance for specifying measurement equipment (in particular power analyzers) for such tests. The standard specifically covers
- Issues associated with power measurements of a few watts or less
- Describes the testing of products with a supply voltage between 100V and 250V AC, but may also apply to 3 phase equipment
- May be used in conjunction with other standards for measuring energy efficiency
We should consider this standard as the “guidance for low power measurement”, actual limits are specified in other standards or regulation documentation such as Energy Star or EU directives.
Suggested Equipment Combinations
Measurement Compliance Requirement |
Analyzer |
Accessories(optional) |
Software(Free Download) |
Calibration(optional) |
AC Source |
||||
|
Energy Star IEC62301 EN50564:2011 Standby Power |
|
+ |
|
+ |
|
+ |
|
+ |
|
|
Energy Star IEC62301 EN50564:2011 Standby Power |
|
+ |
|
+ |
|
+ |
|
+ |
|
|
Energy Star IEC62301 EN50564:2011 Standby Power |
|
+ |
|
+ |
|
+ |
|
+ |
|
|
Energy Star IEC62301 EN50564:2011 Standby Power |
|
+ |
|
+ |
|
+ |
|
+ |
|
|
Energy Star IEC62301 EN50564:2011 Standby Power |
|
+ |
|
+ |
|
+ |
|
+ |
|
What are the limits for standby power consumption?
In the EU, the limits for standby power are detailed in EU regulation 1275/2008/IEC, we have presented the limits in the table below;
| 1275/2008/IEC Maximum Limits for Power Consumption | ||
| Mode | Maximum Power Consumption before Jan 07 2010 | Maximum Power Consumption after Jan 07 2010 |
| Off Mode | 1.00W | 0.50W |
| Standby Without Display | 1.00W | 0.50W |
| Standby With Display | 2.00W | 1.00W |
Table 1
This regulation specifically references IEC62301 as a standard to refer to (which has now been superseded by EN50564), this is common with many regulatory documents around the world and EN50564 is the recognised test standard for any low power measurement of household products connected to the mains.
Energy Star Requirement’s 
The Energy Star® program separates different products into categories and specifies limits specific to that product category, various modes are specified depending upon the equipment under test. As an example, the table below indicates limits applied to PC Monitor Displays. Three modes are described in the document titled “Energy star® program requirements for displays”. These are “On mode, Sleep mode and Off mode”
| Energy Star Limits for Power Consumption of PC Monitor Displays | ||
| Mode | Maximum Power Consumption | Notes |
| On Mode | See Section 3.3.1 of Energy star program requirements for displays | “On Power” consumption has varied limits depending upon screen size and pixel density |
| Sleep Mode | 0.5W | Capabilities such as bridge networks allow for increased sleep mode power consumption |
| Off Mode | 0.5W | A product need not have an “Off mode” to be eligible for qualification |
Table 2
It is clear that the limits described in energy star are very similar to the EU regulation 1275/2008/IEC. Even so, reference to each respective document should clearly still be made as compliance to one does not automatically imply compliance to the other.
What dictates a mode as “Off” or “Standby” in EN50564?
To a user, the differences between “off” and “standby” can be quite subtle.
- Off Mode : This mode describes a condition in which the product does not provide any function other than the ability to react to a users action to “activate” or “turn on” the device using a soft button or similar. For the product to enter any other mode the soft button must be pressed and no automatic “cycling” into other modes takes place. Note that in off mode an indication LED can be lit and is not considered a function.
- Standby Mode : Standby mode is one which facilitates one or more of the following functions; Activation of other modes by remote switch (such as a remote control, internal sensor or timers), Continuous function (such as time being displayed on screen, or screen savers)
Modes not considered as “standby” include the following;
- Network communication through network interfaces, this can include RS-232, LAN, USB etc.
- PC’s (or other devices) with “Wake on LAN” capability
- Sleep Mode as defined in Energy Star which maintain network connectivity such as quick restart of PC hard disks
- Security alarm reactivation
- Amongst others
It is possible for a manufacturer to choose to design a product without a standby mode or an off mode, provided that the product has an operating mode meeting the power consumption requirements of the particular directive.
Preparing for Analysis
Once the mode of the device is known, the test equipment can be prepared and EN50564 provides excellent guidance for the selection of such equipment. The N4L Power Analyzers are well suited to standby power testing for various reasons, as described below;
- EN50564 describes the likelihood of current waveform crest factors exceeding CF10 (EN50564:2011 Annex B, section B.1.2), all N4L power Analyzers offer a guaranteed accuracy specification to CF20. Furthermore, N4L Power Analyzers will auto range up without clipping of a waveform up to CF20.
- All N4L Power Analyzers offer true no gap analysis at very high sample rates (PPA500/1500 1Ms/s, PPA4500/5500 2Ms/s), this is a necessity for reliable measurement as standby power modes often exhibit non periodic current pulses. If the analyser employ’s gapped analysis techniques these pulses can be missed and incorrectly power measurements are likely.
Test Environment
EN50564:2011 provides guidance for the test environment when testing low power devices, table 3 below indicates some of the key conditions that should be met
| General Conditions for Measurements of Low Power to EN50564:2011 | ||
| Area | Limits | Notes |
| Test Room | Airflow close to product of less than 0.5m/s, room temperature of 23°C±0.5°C | Airflow across product should be controlled, room temperature typically maintained with air conditioning system. |
| AC Power Source Single Phase | Voltage regulation of ±1%, Frequency stability of ±1% | Mains supplies will not provide sufficient stability, specialist AC Power Sources can be recommended by N4L application engineers |
| AC Power Source Three Phase | Voltage regulation of ±1%, Frequency stability of ±1% | Mains supplies will not provide sufficient stability, specialist AC Power Sources can be recommended by N4L application engineers |
| Artificial (Impedance) Networks | Some low quality AC power sources have high frequency harmonic distortion, in these cases an impedance of 50 Ω/50 μH or 50 Ω/50 μH + 5 Ω as defined in EN 55016-1-2 should be used. | Utilising a high quality low distortion AC Power Source eliminates the requirement for an Artificial (Impedance) Network. |
Table 3
The Harmonic Distortion and crest factor Requirements for the AC Power Source are detailed in table 4 below;
| AC Power Source Harmonic Distortion Requirements for testing to EN50564:2011 | ||
| Parameter | Limits | Notes |
| THD % | 2% | THD is described in EN50564 Section 4.3.2 as “the root-mean-square (r.m.s.) summation of the individual components using the fundamental as 100 %”, this is analysed by the N4L Analyzers proving compliance of the AC source |
| Voltage Waveform Crest Factor | 1.34 ~ 1.49 | This crest factor must be maintained at all times during the test, even under highly distorted loading, this is analysed by the N4L Analyzers proving compliance of the AC source |
Table 4
Section 4.3.2 states that power supplies meeting IEC61000-3-2 are likely to meet the above requirements, ultimately analysis of the power source will determine its compliance to the standard.
Power Measurement Uncertainty
Section 4.4.1 of EN50564 describes the measurement uncertainty permitted with respect to the power analysis equipment including any external shunts utilised in the test. The “Maximum Current Ratio” is used to determine the maximum measurement uncertainty and is dependent upon the size and characteristics of the load.
| Maximum Current Ratio (MCR) = | Crest Factor (CF) |
| Power Factor (PF) |
Where crest factor is a ratio of the peak current drawn by the product and the RMS current drawn by the product, the power factor is a ratio of the measured real power to the measured apparent power.
| Relative Uncertainty of Measurement Equipment | ||
| MCR Category | Watts | Permitted Relative Uncertainty introduced by Power Measurement Device |
| ≤10 | ≥1W | ≤2% at 95% confidence level |
| <1W | ≤0.02W at 95% confidence level | |
| >10 | ≥1W | 0.02 × [1+ (0.08 × {MCR − 10})] |
| <1W | The greater of 0.02W or Upc*measured value (Watts) | |
Table 5
Upc = 0.02 × [1+ (0.08 × {MCR - 10})]
Example uncertainty calculation: 2.04W Power Consumption, MCR = 13
Upc = 0.02 × [1+ (0.08 × {13 - 10})] = 0.02 × [1+ (0.08 × {13 - 10})] = 0.0248%
The N4L Power Analyzer’s we recommend in the “Example Test configurations” section below all fully comply with the relative uncertainty requirements in table 5 above.
Power Measurement Frequency Response
The frequency response of the Power Analyzer is vitally important in order to obtain accurate measurements and is often overlooked even though EN50564 is very specific with regards to the requirement for wideband performance. The reason for this is that the current waveform of a product when in a low power standby mode can have very high crest factors (in excess of CF10) and as such, the high frequency harmonic components can be significant. In fact, EN50564 is very specific and states that the Power Analyzer used in the tests must be capable of measuring a waveform up to 2kHz with an uncertainty less than or equal to the limits specified in section 4.4.1 of the standard. For clarity we have documented the requirements with respect to frequency response (against the specifications of the various N4L Power Analyzers) in table 6 below.
| Requirement With Respect to Frequency Response (EN50564 Section 4.4.2) | |||
| AC / DC | Accuracy | Compliant N4L Power Analyzers | Notes |
| DC | Meet all specifications as per table 5 above | PPA500(20Arms & 30Arms Models), PPA1500(20Arms & 30Arms Models), PPA4500(10Arms & 30Arms Models), PPA5500(10Arms & 30Arms Models) | No requirement for external low current shunt |
| AC up to and including 2kHz | Meet all specifications as per table 5 above | PPA500(20Arms & 30Arms Models), PPA1500(20Arms & 30Arms Models), PPA4500(10Arms & 30Arms Models), PPA5500(10Arms & 30Arms Models) | No requirement for external low current shunt |
Table 6
Note : The PPA55x1 can offer a fully compliant solution when used in conjunction with an N4L HF external current shunt or any compliant current measurement sensor, this offers the flexibility of measurement up to 50Arms along with excellent low level sensitivity for low power standby measurements to EN50564.
Power Measurements – Sampling approaches
The type of measurement approach will depend upon the characteristics of the power consumption “mode” with respect to time. A “mode” is considered to be “persistent where the power level is constant or where there are several power levels that occur in a regular sequence for an indefinite period of time.” Section 5.3.1 of EN50564 states that “Sampling Method” is the preferred method for power analysis of all modes described in table 2 of this article.
| Measurement Methods detailed in EN50564:2011 Section 5.3.1 | |
| Method | Description |
| Sampling Method | If the product under test has a varying power in a cyclic fashion, is unstable or for limited duration modes – the sampling method is the only permitted measurement approach |
| Average Reading Method | Where the power consumption is stable and the mode is stable, the average reading method is a valid measurement approach. This is performed by averaging the readings over a set period and dividing by the time |
| Direct Meter Reading Method | When the power reading is stable and the mode is stable, by simply recording the instrument power reading |
Table 7
All N4L Power Analyzers’ employ the “Sampling Method” for Analysis of standby power as this is the preferred method. The “Sampling method” provides the fastest test method when the mode is stable, this method should always be used whenever there is doubt as to the stability of the mode or the behaviour of the product. The standard states that the recording of power, voltage, current and other key parameters shall be recorded at intervals not exceeding 1 second.
Non Cyclic Measurements
When the power consumption of the product under test is “non-cyclic”, the average power is assessed as follows;
| Non Cyclic Standby Power Measurement: EN50564:2011 Section 5.3.2 | |
| Notes | |
| Test Duration | Not less than 15 minutes |
| Discard of data | Data from the first third of the test is always discarded, stability is determined from the second 2/3 of data |
| Establishment of Stability | ≤1 Watt : Linear regression of the power readings for final 2/3 of the test is less than 10mW/hr |
| >1 Watt : Linear regression of the power readings for the final 2/3 of the test is less than 1% of the input power/hr | |
Table 8
If after 15 minutes of testing the stability criteria specified in table 8 are not achieved, the test period is continuously extended until the stability criteria is achieved (in the final 2/3 of the test period) If stability is not able to be achieved after 3 hours of testing, the raw data should be assessed in order to determine if there are any patterns in the power consumption of the device that could be averaged in order to satisfy the stability requirements. Once stability is achieved the results are taken and this is considered to be the average power consumed in the second two thirds of the test. If a mode is known to be non-cyclic and of varying power, consumption shall be recorded for a long enough period so that the cumulative range of all data points in the final 2/3 of the test fall within a band of ±0.2%. Testing of such a “non-cyclic varying power” mode shall not be less than 60 minutes to allow sufficient averaging.
Cyclic Measurements
A cyclic measurement is defined as “a regular sequence of power states that occur over several minutes or hours” in section 5.3.2 of EN50564:2011, the standard also states that a minimum of four complete cycles shall be assessed. A cyclic power consumption pattern could be that of a network enabled device that occasionally communicates with a network in a cyclic fashion.
| Cyclic Standby Power Measurement: EN50564:2011 Section 5.3.2 | |
| Notes | |
| Initial Energising | The product shall be energised for not less than 10 minutes prior to recording any data |
| Secondary Stabilisation | The product is then left energised for not less than 2 comparison periods, where a comparison period is not less than two “cycles” and not have a duration less than 10 minutes. |
| Averaging | Calculate the average power for each comparison period |
| Calculate Mid Point in Time | Calculate the mid point in time for each period in hours |
| Establishment of Stability |
Stability is established where the power difference between the two comparison periods divided by the time difference of the mid-points of the comparison periods has a slope of less than; |
|
≤1 Watt : 10mW/hr |
|
|
>1 Watt : 1% of the measured input power per hour |
|
| If Stability is not reached | Additional cycles are added equally to each comparison period until above criteria is reached |
Once stability is achieved, the power is determined as the average of the readings from both comparison periods. Where the cycles are not stable or are irregular, a minimum of 10 cycles are recommended in order to adequately characterise power consumption.
Limited Duration Modes
A manufacturer may specifically state a product has modes of “limited duration”, in these cases the mode will be recorded for its entire duration. The results of such tests are reported as an energy consumption in Watt Hours (Wh) and its duration is indicated, a statement in the report indicating that the mode was of “limited duration” should be made. If a mode is of limited duration, there is no requirement for the product to be operated for a minimum period before the test (such as in the cyclic test). If a product exhibits several “limited duration modes” of differing power, each mode should be recorded separately and documented accordingly.
Average Reading and Direct Meter Reading Methods
The sampling method offers a more comprehensive test of a product in comparison to the average reading method and direct meter reading methods, N4L have therefore implemented the sampling method.
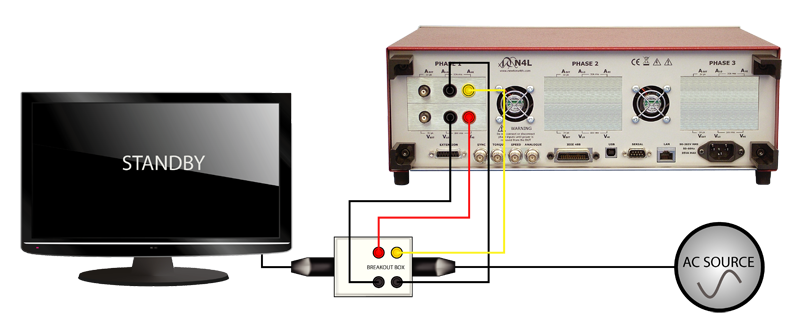
Setting up the Test N4L: Standby Power Software and the Power Analyzer
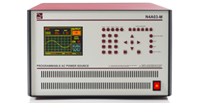
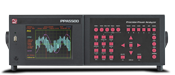
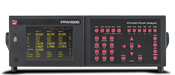
In this example we are going to be testing PC Monitor Displays, in preparation we power on the analyzer (A PPA5530 in this case) and allow it to warm up for 30 minutes, simultaneously we have powered up the AC source (A low distortion IEC61000-3-2 compliant source in this case) at 230Vrms, 50Hz.
 |
PPA5510 Pictured Above
Previous analysis of the monitors we will be testing has shown that the power consumption is “non cyclic”, as described in EN50564:2011 and we will select this option in the N4L Standby Power Software. We remember from table 8 that if the product under test is non-cyclic then we must perform the test for at least 15 minutes, discarding the first third of data and ensuring that the linear regression of the final two thirds of the test satisfy the criteria for stability. In our case the monitors should be consuming ≤1 Watt, therefore we will be expecting to see a linear regression of the power readings for the final 2/3 of the test that is less than 10mW/hr.
N4L Standby power software takes care of all of the above requirements automatically, it will set the minimum test period to 15 minutes, assess the final two thirds of the test whilst discarding the first third. Further to this, the test period is automatically extended if stability cannot be achieved after 15 minutes up to a maximum test time of 3 hours.
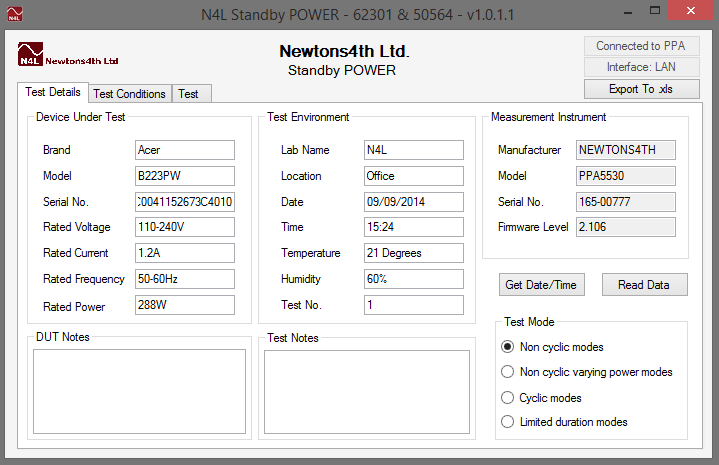 |
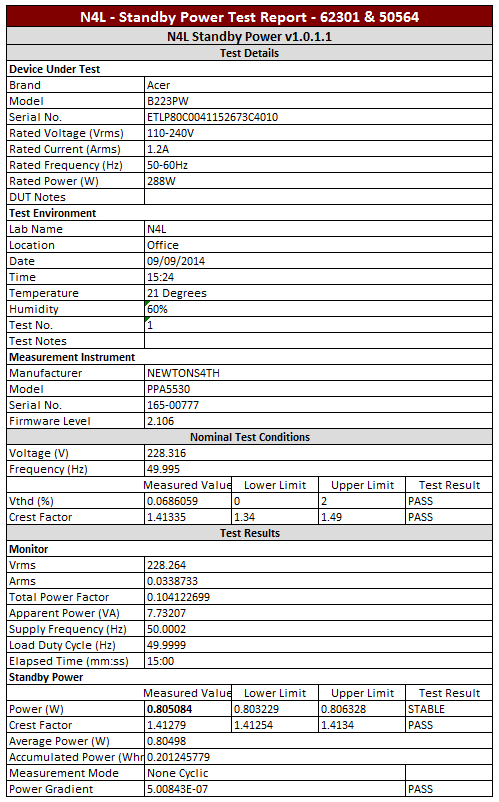
N4L Standby Power Software presents the user with an intuitive user interface. The Brand, Model, Serial number, Rated Voltage, Current, Frequency and Power are all inputted. The test environment data is also entered along with auto detection of the Measurement Instrument details. The “test Mode” dialog is set to “Non cyclic modes” in order to reflect the power consumption characteristics of the PC Monitor Displays we will be analysing in our example tests. The first product we tested was an ACER B223PW PC monitor, its rated current was 1.2A and it was manufactured in 2011. If we recall the EU directive 1275/2008/IEC Maximum Limits for Power Consumption, we are looking for a power consumption below 1W for devices with a display in order to comply. Current Energy Star limits for standby power consumption for PC Monitor displays as described in this document state 0.5W maximum consumption measured in accordance with IEC63201 Ed 2.0, as EN50564 has replaced IEC62301 Ed 2.0 we can refer to the EN standard for measurement requirements.
|
The next step is to test the AC source for compliance in accordance with table 3 in this article and section 4.3 in EN50564:2011. We will be measuring THD, Crest Factor, Voltage regulation and Frequency stability – all will be tested against the limits specified in EN50564
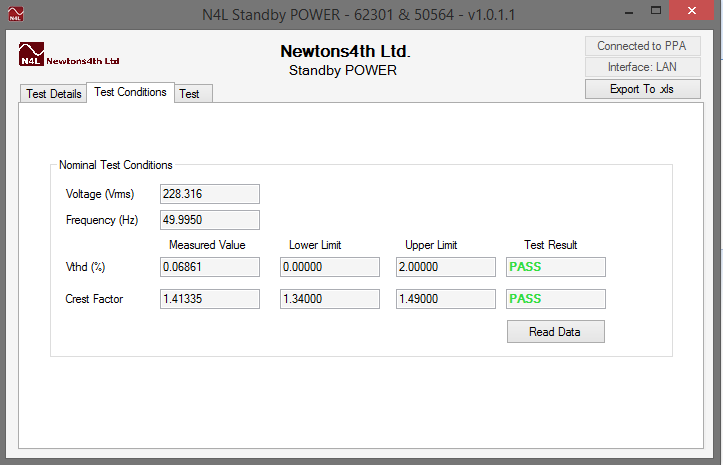 |
At this stage we recommend that the device under test be physically connected to the output of the AC source and set to standby mode. This will result in the initial tests of the AC source being carried out under test conditions and will be representative of the behaviour of the AC source during the test. There is little benefit in testing the AC source with zero load as the test results may not be representative of the on-load output waveform of the Power Source. As we can see the Voltage Total Harmonic Distortion (THD %) was only 0.06861% for the AC source in use, this is very good and will offer an excellent clean power supply waveform for reliable comparison of results. The crest factor was also very good and almost a perfect sinusoid. |
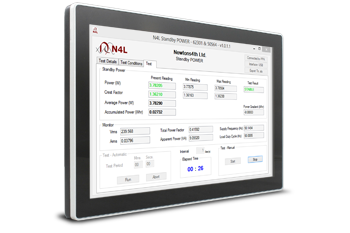
The next step is to select the “Test” tab and hit the “Start” button, this will commence the test period (minimum of 15 minutes) and data is collected at 1 second intervals.
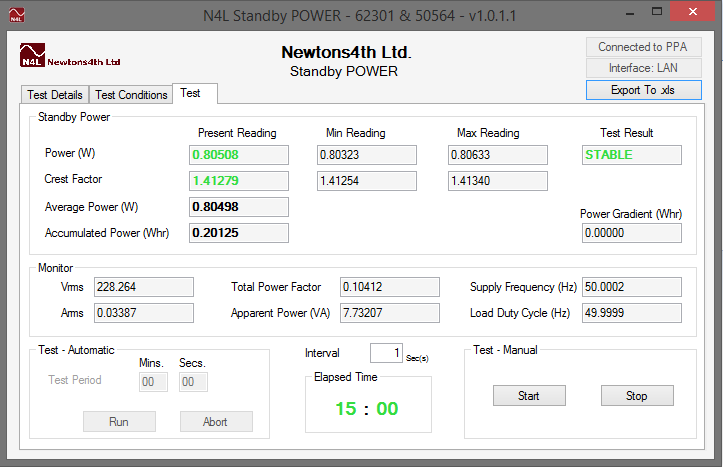 |
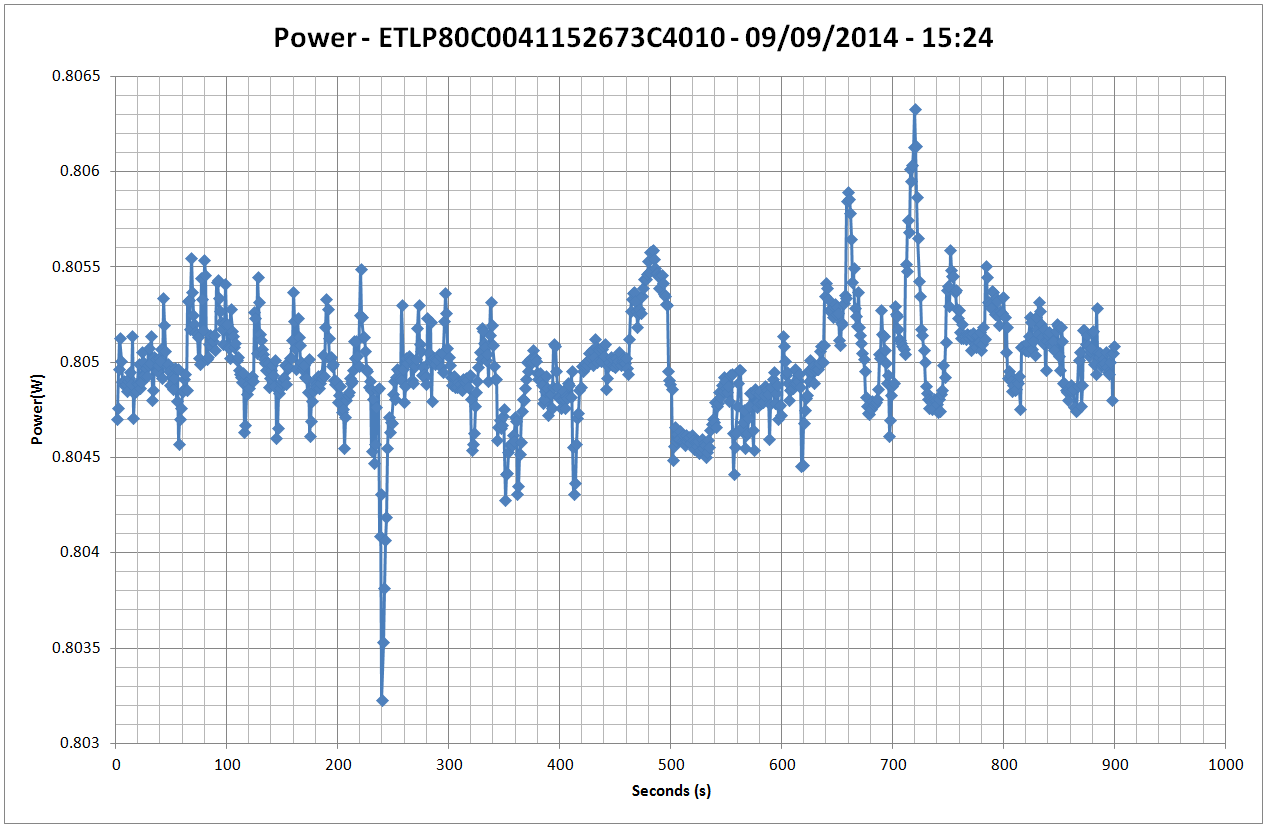
The user interface of N4L Standby Power software offers a range of information useful to the test engineer. The accumulated data is continuously analysed and the power gradient (analyzed as per EN50564:2011) is continually updated. In this test the power gradient was very low after 15 minutes and a result of 0.00000 (zero to 6 decimal places) was displayed. We can see that the power consumption was 0.80508 Watts with maximum and minimum readings very close to this figure, confirming to us that the consumption was indeed “non cyclic”. We can now export this data as an excel report. |
Reporting
EN50564:2011 is very specific with regards to reporting of standby power, N4L standby power software complies with all requirements specified in EN50564:2011. Example screen shots of the excel report are illustrated below;
 |
 |
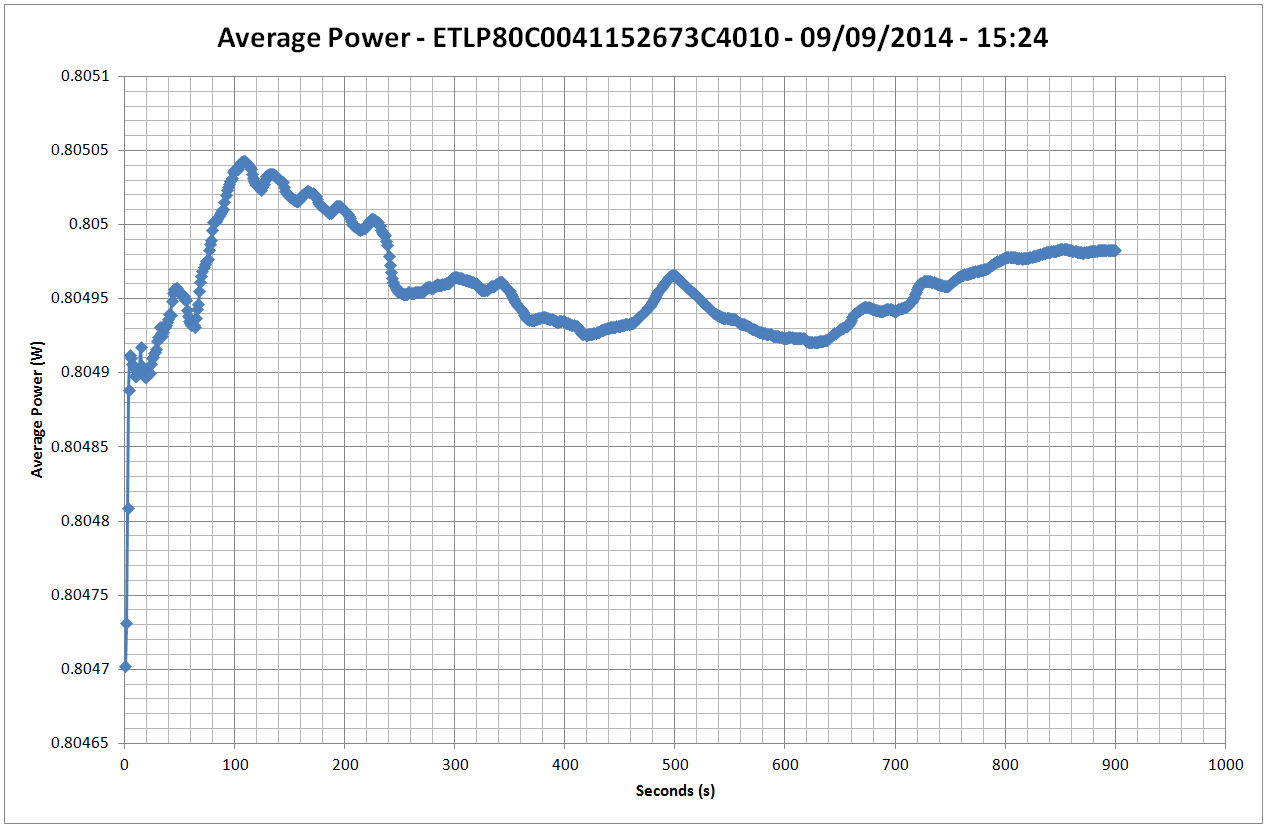 |
Additionally, graphs detailing the Vrms, Arms, Accumulated Power and the data log are all exported to excel from the N4L Standby Power Software.
Results
Below we list the results of various PC monitors assessed for standby power consumption in accordance with EN50564:2011, all products performed well in the test with very stable and most importantly low power consumption.
| Standby Mode Power Consumption for PC Monitor Displays | ||
| Brand | Model | Standby Power Consumption |
| ACER | B223PW | 0.80508 |
| ACER | B223PW | 0.81755 |
| Samsung | S24C300H | 0.33819 |
| BENQ | ET37309 | 0.38240 |